Giotto Viewer
Introduction
Giotto Viewer is a web-based visualization package for spatial transcriptomic data. It interactively displays spatial gene expression data, and allows users to interact with the data which would be otherwise difficult to do in a static visualization. Specifically, Giotto Viewer allows users to:- create panels for a comparison of spatial annotations and cell type annotations for individual cells
- switch between displaying different annotations
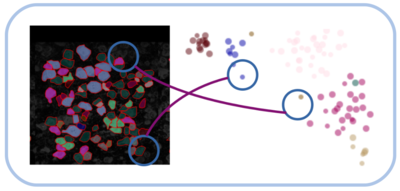
- intuitively select specific cells of interest
- display staining images and cell morphology information
- finally display transcript localization data
Live Demo of Giotto Viewer
Giotto Viewer for the Visium dataset (mouse brain, coronal slice)Web demo of other datasets
A demo of the visual cortex dataset (seqFISH+) with 523 cells, 10,000 genes has been created, and can be viewed.This dataset contains close to transcriptome-wide measurement of spatial gene expression in all 6 layers of the visual cortex. Cell segmentation, staining images have been saved. Gene expression matrix is published along with the original paper (Eng et al, Nature 2019).
A demo of the olfactory bulb (seqFISH+) with ~2000 cells, 10,000 genes can be viewed.
Installing Giotto Viewer
The best way to install Giotto Viewer is by using the Docker image (see Docker install)Alternatively, it is possible to install Giotto Viewer natively in OS. Linux and MacOS X is supported in this case. For Windows users, docker is the best way to use viewer.
Native install: Pre-requisite software
Follow this link (installation) to learn about installation instructions. In short, the list of pre-requisite software includes:- Tile-up Ruby package
- ImageJ library (JAR file)
- ImageMagick